
Last Updated: October 26, 2026
Quick Summary
A peptide mass spectrometry report documents an MS experiment that confirms a peptide’s molecular identity by measuring its mass and fragmentation pattern. It combines raw spectral data with interpretation, including observed versus theoretical mass, mass accuracy in ppm, and the supporting spectra. Every report should tie to a specific lot number for traceability.
- Start by comparing observed versus theoretical mass, then confirm the spectrum supports that number.
- A peak at m/z 624.8 labeled charge state 2+ corresponds to a neutral mass near 1,247.6 Da.
- Isotope peaks for a 2+ ion are roughly 0.5 m/z apart, a quick check on charge state.
- An intact-mass report confirms identity but does not by itself establish purity or sequence order.
- Ask for batch documentation before placing the order, not after.
Table of Contents
- What a Peptide Mass Spectrometry Report Actually Contains
- How to Read a Peptide Mass Spec Report Step by Step
- Expected vs Observed Peptide Mass: Why the Numbers Diverge
- Peptide Purity Testing by HPLC and How It Complements MS
- What a Peptide Certificate of Analysis Should Include
- Quality Control Criteria and Troubleshooting Unexpected Results
- Requesting Verified Lots and Batch Documentation
- Frequently Asked Questions
What a Peptide Mass Spectrometry Report Actually Contains
A peptide mass spectrometry report is the documented output of an MS experiment that confirms a peptide’s molecular identity by measuring its mass and fragmentation pattern.
The document typically runs several pages and combines raw spectral data with interpretation. A supplier’s marketing page tells you what a peptide should be. A mass spectrometry report shows you what the lot actually is.
The Core Data Fields and What Each One Proves
Every report carries a set of standard fields, and each one answers a different question:
- Sample identification and lot number: proves which batch was tested, not just which product
- Method summary: states the instrument type, ionization mode, and acquisition parameters used
- Observed mass: the measured molecular weight of the intact peptide
A report missing any of these is incomplete. The lot number matters most for traceability: without it, the data cannot be tied to the vial in your freezer.
Every report carries a set of standard fields, and each one answers a different question.
| Field | What it proves |
|---|---|
| Sample identification and lot number | Which batch was tested |
| Method summary | Instrument type, ionization mode, acquisition parameters |
| Observed mass | Measured molecular weight of intact peptide |
| Theoretical mass | Calculated mass from the peptide sequence |
| Mass accuracy | Difference between observed and theoretical, usually in ppm |
| Spectrum or spectra | Raw peak data supporting the identification |
| Analyst and date | Who ran the test and when |
How to Read a Peptide Mass Spec Report Step by Step
Start with the observed versus theoretical mass, then confirm the spectrum supports that number. That single comparison answers the identity question in most cases. Everything else in the report exists to support or qualify that comparison.
Here is the sequence we recommend:
- Match the lot number on the report to the lot number on the vial label
- Locate the theoretical mass calculated from the stated sequence
- Find the observed mass from the intact MS experiment
- Calculate the difference and check it against the stated mass accuracy
- Inspect the spectrum for the expected peak pattern
- Review any MS/MS data if fragmentation was performed
- Check the analyst sign-off and date for completeness
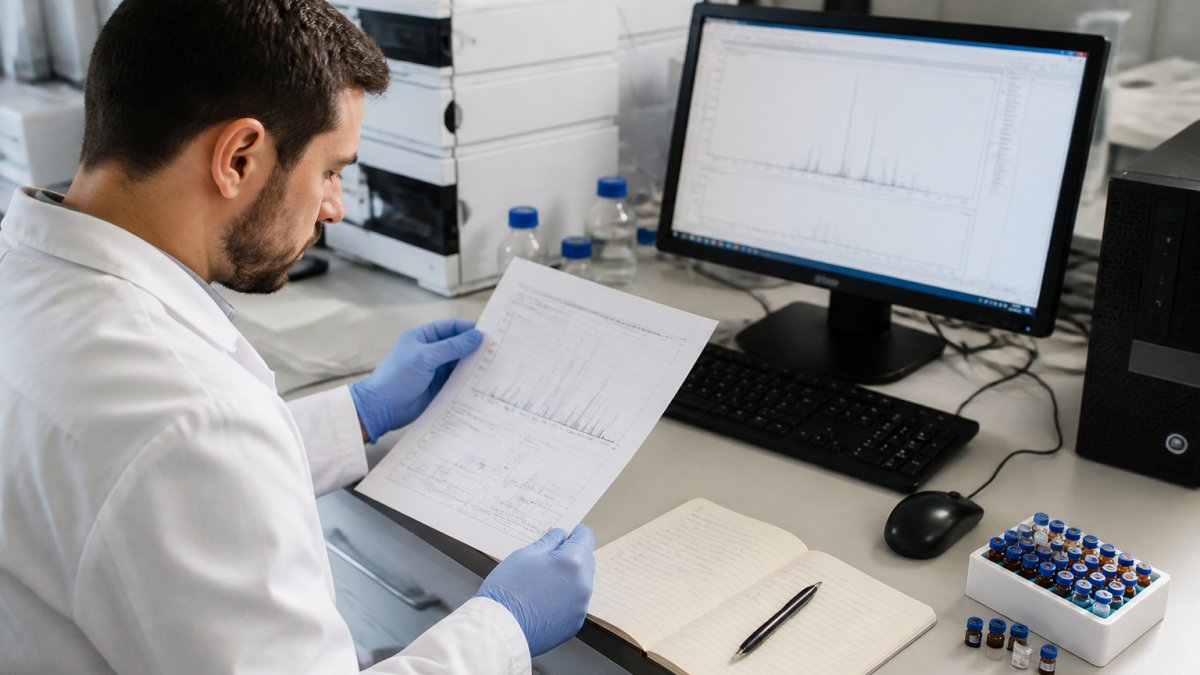
Reading Precursor Ions, Fragment Ions, and m/z Values
The precursor ion is the intact peptide ion selected for measurement, and its mass-to-charge ratio (m/z) reveals the peptide’s molecular mass. The fragment ions are the pieces produced when that precursor is broken apart in MS/MS analysis.
The m/z value is mass divided by charge (pubmed.ncbi.nlm.nih.gov). A singly charged ion reports its mass directly; multiply by the charge state for multiply charged ions.
A Worked Example: Reading One Annotated Report
Abstract descriptions of spectra are hard to apply. Below is the structure of a typical intact-mass report for a small synthetic peptide, with each field explained the way you would actually check it.
- Sequence and theoretical mass. The report states the sequence and the calculated monoisotopic mass. Monoisotopic mass uses the most abundant isotope of each element; average mass uses the natural isotopic mix. For peptides under roughly 2,000 Da the two differ by only a fraction of a Dalton, but the report should say which one it is using so your comparison is apples to apples.
- Observed m/z and charge state. The intact spectrum usually shows the peptide as several peaks, not one, because the same molecule carries different numbers of protons. A peak at m/z 624.8 labeled as charge state 2+ corresponds to a neutral mass near 1,247.6 Da (2 × 624.8 minus the mass of two protons). If you read that peak as singly charged, you would double the apparent mass and wrongly conclude the lot is wrong.
- Mass accuracy in ppm. Parts per million is the difference between observed and theoretical mass divided by theoretical mass, times one million. A 1 Da error on a 1,000 Da peptide is 1,000 ppm; the same 1 Da error on a 10,000 Da peptide is 100 ppm. This is why ppm, not absolute Dalton difference, is the field to compare against the acceptance criterion.
Before you accept any report, confirm the charge state assumption. A single misread charge state is the most common reason a correct lot looks wrong, and it is the first thing an experienced reviewer checks.
What the Report Does Not Tell You
An intact-mass report confirms molecular identity; it does not by itself establish purity, sequence order, or the absence of a near-isobaric contaminant. Those questions require HPLC, tandem MS, or both. Treat the intact mass as one line of evidence, not the whole case.
Expected vs Observed Peptide Mass: Why the Numbers Diverge
Small differences between expected and observed peptide mass are normal and usually reflect measurement conditions, not a quality problem. The theoretical mass comes from a calculation; the observed mass comes from an instrument, and instruments carry small, documented error margins.
Common reasons the numbers diverge:
- Ionization adducts: sodium or potassium ions bind to the peptide and shift the measured mass
- Charge state confusion: reading a doubly charged peak as singly charged doubles the apparent mass
- Calibration drift: an instrument slightly out of calibration shifts every reading
A divergence within the stated mass accuracy is expected. A divergence far outside it, or one that matches a known modification, needs explanation before you trust the lot.
Peptide Purity Testing by HPLC and How It Complements MS
HPLC and mass spectrometry answer two different questions, and a complete report needs both. HPLC measures purity: what percentage of the sample is the target peptide. MS measures identity: whether that target is actually the right molecule.
You can have a 99% pure sample of the wrong peptide. If you want the full laboratory procedure for confirming purity, our guide on how to verify peptide purity walks through the seven-step process.
What a Peptide Certificate of Analysis Should Include
A peptide certificate of analysis should state the lot number, the test methods used, the HPLC purity result, the mass spectrometry identity confirmation, and the storage and handling conditions. The certificate is the summary; the underlying reports are the evidence.
Watch out: a certificate that lists a purity figure without naming the method or lot number is unverifiable, and you should treat it as marketing rather than documentation. If you are weighing whether the paperwork justifies the effort, our article on whether research peptides with COA are worth the paperwork covers that trade-off directly.
Quality Control Criteria and Troubleshooting Unexpected Results
Set acceptance criteria before you open the vial, not after. Define the minimum HPLC purity, the acceptable mass accuracy window, and the required documentation, then hold every lot to those thresholds. This is the discipline that keeps a research program reproducible across batches.
Acceptance Criteria to Write Down Before Testing
Most laboratories that rely on supplier documentation settle on a small set of criteria. The exact numbers depend on the peptide and the method, but the categories are consistent:
- Mass accuracy window. State the maximum ppm deviation you will accept between observed and theoretical mass. A tighter window catches more problems but rejects more good lots when the instrument is near its calibration limit.
- Purity floor. State the minimum HPLC purity, and state the method (column, gradient, detection wavelength) so the number is comparable across lots.
- Identification confidence. For tandem MS results, state the minimum score or the maximum false discovery rate you will accept. False discovery rate is the estimated share of identifications that are wrong; a lower threshold means fewer accepted identifications but more confidence in each one.
A purity figure without a named method and lot number is not a quality result. It is a marketing number. Do not let it into your acceptance record.
Calibration and Mass Error: What Makes a Result Reliable
Mass accuracy is only meaningful if the instrument was calibrated recently and the calibration is documented. Ask whether the report states the calibration standard and date. A result that falls outside your ppm window on an instrument with an expired calibration is inconclusive, not a failed lot.
A common pattern is a small, consistent offset across every peak in a spectrum. That points to calibration or a systematic adduct, not to a sequence error.
Troubleshooting Unexpected Results in Order
When results look wrong, work through the likely causes in order, from the cheapest explanation to the most serious:
- No expected peak at all. Check the charge state and the m/z calculation first. Confirm the peptide is soluble under the sample preparation used and that the expected retention time was actually collected.
- Peak present but shifted. Suspect adducts (sodium or potassium), calibration drift, or a modification. Compare the size of the shift to the mass of common adducts and modifications before assuming a sequence error.
- Multiple peaks. Could be degradation, a mixture, or incomplete synthesis. Check whether the extra peaks are consistent with known degradation products of the sequence.
A common mistake is blaming the supplier before ruling out sample handling. Degradation during storage produces the same signature as a bad lot. If results stay inconsistent, our step-by-step guide on how to compare peptide batches shows how to isolate whether the problem is the lot or the handling.
The goal of QC is not to catch a bad supplier. It is to make every batch decision reproducible, so a result that looks surprising can be traced to a specific cause instead of a guess.
Requesting Verified Lots and Batch Documentation
Ask for the batch documentation before you place the order, not after. A supplier confident in its testing will send the lot-specific report without hesitation. The request itself is a useful filter.
At Emerald Science, every product carries a unique batch number, each lot is independently tested, and identity is mass-spec verified with HPLC purity of at least 99%. We provide PDF documentation you can file directly in your research records, no special software required.
Two checks are worth running on any supplier. First, confirm the batch number on the vial matches the batch number on the report. Our guide on how to verify a peptide batch number walks through the seven-step check. Second, confirm the supplier itself is legitimate before you trust its paperwork, which our guide on how to verify peptide supplier legitimacy covers in detail.
Frequently Asked Questions
What information is included in a peptide mass spectrometry report?
A standard report lists the peptide sequence, calculated and observed molecular mass, the ionization method used, and the full mass spectrum with labeled precursor and fragment ions. It also includes the m/z values, peak intensities, and the software or method used for analysis. Many reports add a sequence coverage map and any post-translational modifications detected. The document should be traceable to a specific lot number so you can match it to the vial in your freezer.
Can mass spectrometry confirm peptide purity?
Mass spectrometry confirms identity, not purity. It tells you the observed mass matches the expected mass for your sequence, but it does not quantify how much of the sample is that peptide versus truncated or modified variants. Purity is measured by HPLC, which separates components and reports the percentage area of the main peak. A complete verification package pairs peptide mass spectrometry data with HPLC purity results so identity and purity are both documented.
What can cause a peptide’s measured mass to differ from its expected mass?
Small differences within a few parts per million usually reflect instrument calibration and are normal. Larger shifts point to a real issue: an extra or missing amino acid, incomplete deprotection, oxidation of methionine or tryptophan, N-terminal acetylation, or salt adducts from residual trifluoroacetic acid or sodium. If the observed mass is off by roughly the mass of water (18 Da), suspect a truncated sequence. Always compare against the calculated mass for the exact sequence and modification state you ordered.
How do you verify peptide identity using mass spectrometry?
Calculate the theoretical monoisotopic mass from the sequence, then compare it to the observed mass in the report. The two should agree within the instrument’s tolerance, typically under 10 ppm for high-resolution instruments. Next, check that fragment ions in the MS/MS spectrum map to the expected b- and y-ion series across the sequence. Good sequence coverage, meaning most of the backbone is accounted for by fragment ions, gives strong confidence the peptide is what the certificate says it is.
What is the difference between mass spectrometry and HPLC for peptide analysis?
HPLC separates molecules by how they interact with a column and reports purity as the percentage area of the main peak. Mass spectrometry measures the mass-to-charge ratio of ions and reports molecular identity. They answer different questions: HPLC tells you how much of the sample is your target peptide, while MS tells you whether that peptide has the correct structure. Using both gives you a purity figure and an identity confirmation, which is why quality suppliers report both on the same lot.
What should a peptide certificate of analysis include?
A useful certificate of analysis lists the peptide name and sequence, lot or batch number, molecular weight, HPLC purity percentage with the chromatogram, mass spectrometry method and observed mass, appearance, and storage recommendations. It should name the testing laboratory and the date of analysis. If the supplier claims 99% purity, the chromatogram should show a main peak at or above that level. Ask for the raw data file if your grant or internal audit requires independent review.
The gap between a verified peptide and an unverified one comes down to documentation you can actually check, lot by lot. Emerald Science builds that verification into every order: independently tested batches, mass-spec verified identity, unique batch numbers on every product, and same-day shipping on orders placed before 2 PM EST. Get started with Emerald Science and put verified documentation behind every experiment.