
Last Updated: October 23, 2026
Quick Summary
To compare peptide batches, pull the lot number, the lot-specific certificate of analysis, the original laboratory report, and the shipping and storage record for each batch. Then check that the lot number, peptide name and sequence, and fill date all match, and compare HPLC method parameters alongside purity figures rather than numbers alone.
- A peptide batch is a single production run made under one set of conditions.
- Check the COA method column before the result column, since the method determines what the number means.
- A 5 mg label with 80% net peptide content delivers 4 mg of peptide.
- HPLC purity is main peak area divided by total peak area, times 100.
- A batch can be 99% pure and still be the wrong peptide without mass spec identity confirmation.
Table of Contents
- Start with the Batch Record: What to Pull Before You Compare
- Read the Peptide Certificate of Analysis Like a Reviewer
- Match the COA to the Exact Peptide and Lot Number
- HPLC Peptide Purity Testing: What the Chromatogram Actually Shows
- Mass Spectrometry Peptide Identity: Confirming the Molecule
- Peptide Lot Traceability: Following a Batch from Synthesis to Bench
- A Side-by-Side Batch Comparison Worksheet
- Resolve Conflicting or Incomplete COAs: A Decision Framework
- Frequently Asked Questions
Start with the Batch Record: What to Pull Before You Compare
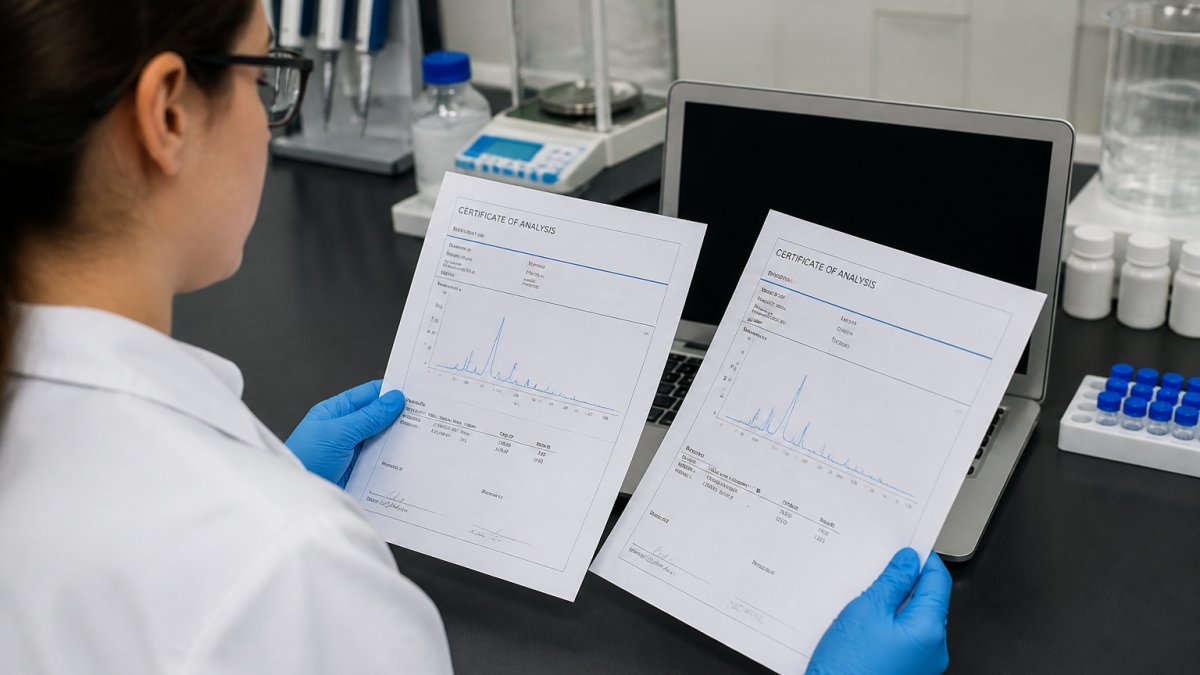
To compare peptide batches correctly, pull four documents first: the lot number from the vial label, the full certificate of analysis, the supplier’s original laboratory report, and the order record showing storage and shipping conditions.
At Emerald Science, we ship a unique batch number on every product for exactly this reason. Without a batch record, you are comparing marketing claims, not material.
Here is what to pull:
- Vial label photo showing the lot number and fill date
- Certificate of analysis for that specific lot, not a sample COA
- The original laboratory report the COA was built from
A peptide batch is a single production run made under one set of conditions. Two vials from the same lot should behave identically. Two vials from different lots may not.
That distinction drives everything below.
Never compare two batches using a generic COA pulled from a supplier’s product page. If the lot number on the report does not match the vial in your hand, the document tells you nothing about your material.
Read the Peptide Certificate of Analysis Like a Reviewer
A peptide certificate of analysis is a lot-specific document reporting test method, result, specification, and test date for a single batch.
Review each COA against this checklist:
- Lot number matches the vial exactly
- Test date falls before the ship date, not after
- Test method named for each assay (HPLC, mass spec, and so on)
A COA that lists “99% pure” with no method, no lab, and no test date is not a certificate. It is a claim.
For context on what a defensible analytical document should contain, the FDA guidance on analytical procedures and methods validation sets out how method validation and documentation are normally handled in a regulated setting.
Match the COA to the Exact Peptide and Lot Number
Matching a COA to a lot is a three-point check: peptide name and sequence, lot or batch number, and fill date. All three must line up. Two out of three is a fail.
Here is how batch records go wrong in practice:
- The COA covers the peptide but a different lot
- The lot matches but the peptide form differs (salt vs. free base)
- The sequence matches but the labeled amount does not
That third point catches people. Labeled amount is what the vial says it contains. Net peptide content is the actual peptide mass after accounting for counterions and water.
Ask your supplier whether the purity figure refers to the peptide peak alone or to total material. Those are different numbers, and the gap between them is where batch inconsistency hides.
HPLC Peptide Purity Testing: What the Chromatogram Actually Shows
HPLC peptide purity testing separates a sample’s components and reports the area percentage of the main peptide peak: main peak area divided by total peak area, times 100. A figure of 99% means 99% of the detected UV-absorbing material eluted as the main peak, not that the vial is 99% peptide, and not that the peak is the right molecule.
How the purity number is actually calculated
The instrument integrates the area under every peak the detector sees, then divides the main peak area by the sum. Three method choices move that number without any change to the material:
- Detection wavelength. Most peptide methods read absorbance near 214 nm, where the peptide bond absorbs strongly. A method run at 280 nm sees only aromatic residues and will miss many impurities, and many peptides entirely.
- Column and gradient. A shallow gradient over a long run resolves closely related impurities; a steep gradient over a short run compresses them into the main peak. The same sample can read 95% on one method and 98% on another.
- Integration settings. Where the software draws the baseline between a main peak and a shoulder changes the reported percentage. Slope sensitivity and peak width settings are operator choices, not physical facts.
Compare method to method, not number to number. Two labs running different columns, gradients, and wavelengths can report different purity for the same vial, measurement uncertainty, not necessarily fraud.
Reading the chromatogram itself
When you look at the actual trace, check:
- Retention time, does it match the expected elution window for that peptide on that method?
- Peak symmetry, a tailing or fronting main peak suggests co-eluting material or column issues.
- Shoulder peaks, closely related impurities, often deletion or truncation sequences from synthesis.
What the chromatogram cannot tell you
A UV-HPLC purity percentage establishes only that the detected material is mostly one peak under those conditions. It cannot establish:
- Identity, a wrong but similarly sized peptide can elute at the same time. Mass spectrometry is required to confirm the molecule.
- Quantity, peak area percentage says nothing about how many milligrams are in the vial. Net peptide content is a separate measurement.
- Non-UV-absorbing contaminants, compounds that do not absorb at the detection wavelength are invisible to the method.
Treat the chromatogram as evidence of relative cleanliness under one set of conditions. Pair it with mass spectrometry for identity and a separate assay for quantity before you treat a batch as characterized.
When you compare two batches, record the method parameters alongside the purity figure. A 97% result on a resolving method can represent cleaner material than a 99% result on a compressed one.
Mass Spectrometry Peptide Identity: Confirming the Molecule
Mass spectrometry peptide identity testing confirms the molecule in the vial matches the expected sequence by measuring its mass-to-charge ratio.
You need both. A batch can be 99% pure and still be the wrong peptide.
What to check on the mass spec report:
- Observed mass versus calculated theoretical mass
- The ionization method used
- Whether the reported value is the intact mass or a fragment
A match within normal instrument tolerance confirms identity; a mismatch means the sequence, modifications, or salt form differ from the label.
For deeper background on how these techniques are applied to peptide characterization, the National Institute of Standards and Technology publishes reference material and measurement science resources that explain method traceability.
Purity without identity is incomplete. A COA that reports HPLC purity but no mass spec confirmation has verified cleanliness, not identity.
Peptide Lot Traceability: Following a Batch from Synthesis to Bench
Peptide lot traceability is the ability to follow a batch from synthesis through purification, testing, filling, storage, and shipment using records that link each step, what lets you trust a COA months after purchase.
Ask whether the supplier can produce, on request:
- The synthesis and purification record for the lot
- The testing laboratory’s original report
- Storage conditions before shipment
Supplier transparency shows up in small details. A supplier that answers these questions quickly has records worth having.
Storage history belongs in your comparison. A peptide that sat warm for a week during shipping may test differently than one shipped cold, even from the same synthesis run. Degradation shows up as new peaks on a later chromatogram.
A Side-by-Side Batch Comparison Worksheet
Use this worksheet to compare two or more lots on the same criteria. Score each field, then compare totals.
| Criterion | What to Record | Batch A | Batch B |
|---|---|---|---|
| Lot number match | Vial vs. COA | ||
| Test date | Before ship date? | ||
| HPLC method | Column, gradient, wavelength | ||
| Purity percentage | Main peak area % | ||
| Impurity profile | Shoulders, early peaks | ||
| Mass spec result | Observed vs. theoretical | ||
| Net peptide content | Stated on COA? | ||
| Testing lab | Named and independent? | ||
| Storage record | Temperature history | ||
| Retest date | Provided? |
Score each row pass, partial, or fail. Two failing rows in the identity or purity block should stop the comparison.
Resolve Conflicting or Incomplete COAs: A Decision Framework
Conflicting COAs are normal. Incomplete ones are a warning. The difference between a routine discrepancy and a documentation failure is whether you can trace the number back to a method, a lab, and a lot. Use this escalation path in order, and stop at the first step that fails.
Step 1: Confirm you are comparing the same thing
Before treating any gap as a conflict, verify the basics line up:
- Same peptide name, sequence, and salt form (salt vs. free base changes mass and purity)
- Same lot number on both reports
- Same test method, column, gradient, wavelength, run time
Most apparent conflicts dissolve here: a purity gap between a 214 nm method and a 280 nm method is not a disagreement about the material, but two different questions.
Step 2: Decide whether the difference is meaningful
A few points of difference between labs is expected. Ask three questions:
- Are the methods identical? If not, the numbers are not directly comparable.
- How large is the gap? Small differences within normal assay variability are noise. A large gap on identical methods warrants the original data.
- Is the direction consistent? If one lab consistently reads higher across many lots, suspect a method or calibration difference rather than a bad batch.
A common pattern: a supplier reports purity on a fast method while an independent lab runs a resolving method and reports lower. Neither is lying; the methods answer different questions. The resolving result is usually the more conservative one to trust.
Step 3: Request the primary records
If the gap survives Steps 1 and 2, ask in writing for:
- The original laboratory report the COA was built from, not a reformatted summary
- The chromatogram image with integration parameters
- The mass spectrometry spectrum with observed and theoretical masses
A supplier who cannot produce the original report for a specific lot has a documentation problem, not a paperwork problem.
Step 4: Seek orthogonal testing
If the primary records are consistent but you still doubt the result, arrange independent testing using a different method than the one in dispute. Orthogonal methods, a different separation chemistry or a mass-based assay, catch errors a repeat of the same method cannot. Use a known reference standard where available to anchor the result.
Step 5: Decide, accept, hold, or reject
| Situation | Action |
|---|---|
| Methods differ, gap explained | Accept; record both methods |
| Methods identical, small gap | Accept as measurement variability |
| Methods identical, large gap, records provided | Hold; seek orthogonal testing |
| Missing fields, supplier responsive | Hold pending written data |
| Missing fields, supplier unresponsive | Reject as unverified |
| Identity mismatch on mass spec | Reject; do not use |
Treat a batch as unverified, and do not use it in work that depends on reproducibility, when the supplier will not provide primary records or identity cannot be confirmed.
A COA that reports a purity figure but no method, no lab, and no test date is not a certificate. It is a claim, and it cannot be escalated because there is nothing to escalate to.
The International Organization for Standardization’s quality management standards describe how documented traceability and quality control are normally structured. Those principles apply to any lab that wants defensible records, and they give you a vocabulary for asking suppliers the right questions.
Frequently Asked Questions
How do you compare peptide batches for research?
Compare peptide batches by matching each certificate of analysis to its exact lot number, then checking four things side by side: HPLC purity percentage, mass spectrometry identity confirmation, net peptide content, and the test date. Use the same assay method across lots so the numbers are comparable. If a supplier cannot provide a lot-specific COA, treat the batch as unverified. A simple worksheet with columns for lot number, purity, identity result, test date, and storage history makes batch-to-batch review repeatable and auditable.
What should a peptide certificate of analysis include?
A useful peptide certificate of analysis should list the peptide name and sequence, the lot or batch number, the test date, the assay methods used (HPLC and mass spectrometry at minimum), the purity percentage with the chromatogram attached, the identity result, net peptide content, and the name of the testing laboratory. It should also state whether testing was done in-house or by an independent lab. Missing lot numbers or missing chromatograms are red flags, because they make it impossible to tie the result to the material you actually received.
How can HPLC results help compare peptide batches?
HPLC peptide purity testing separates the peptide from impurities such as peptidic by-products, degradation fragments, and residual solvents, then reports the main peak as a percentage of total peak area. When comparing batches, check that the purity percentage was generated by the same method and column, because a method change can shift results by several points. Also review the chromatogram itself: a clean baseline and a single dominant peak support the stated purity, while extra peaks suggest by-products that a single number can hide.
How do you check whether two peptide batches are consistent?
Check consistency by comparing lot-specific COAs for purity, identity, and net peptide content, then confirm that the difference between the two lots falls within the method’s measurement uncertainty. Small shifts of a fraction of a percent are usually within normal assay variation; larger gaps need an explanation from the supplier. Also compare storage conditions and test dates, since a batch tested months earlier may have degraded in transit. If the numbers conflict, request a retest of the retained sample before accepting the batch.